These kind of MR images quantifies the concentration of various metabolites in the imaged tissue, so one can extract the concentration of different metabolites such as Choline, Creatine and NAA in each voxels of the image. These data typically result from one large-sized imaging voxel (in range of cm) as a 1-D signal in Fourier domain which its extracted features show the concentration of the interested metabolite(s).
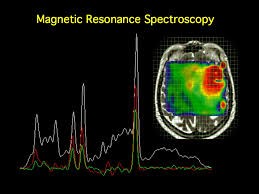
Figure 1: an example of Analyzed MRS data (Multi-Voxel Spectroscopy MVS or Chemical Shift Imaging CSI)
List of Services:
The MRS data are analyzed using jMRUI and TARQUIN (MATLAB toolbox) software packages which are the mostly-used MRS data analysis software in the MRI community.
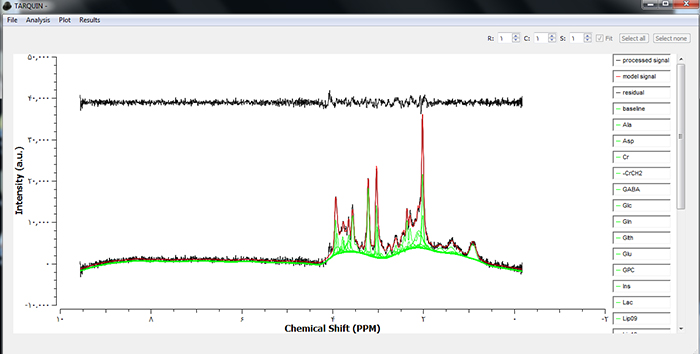
Figure 2 : An example of MRS data Analysis using TARQUIN MATLAB Toolbox