Oxygen is delivered to the neurons by hemoglobin. As neuronal activity increases, the demand for oxygen by neurons increases, resulting in increased blood flow in the area of neuronal activity. Oxygen-containing hemoglobin has a magnetic property. This feature of the blood causes a small difference in the magnetic resonance (MR) signal. since blood oxygen levels vary depending on the level of neuronal activity, these changes can be used to record brain activity. Because this type of imaging records functional activity of brain, it is called functional Magnetic Resonance Imaging (fMRI).

Figure 1: Increasing vascular size due to neural activity and thus increased blood flow in the area of euronal activity
List of services:
There are two types of fMRI study, the first type is task-based fMRI tries to record brain activity during a particular task. These studies are usually performed under a specific cognitive and perceptual activity or movement, and their purpose is to find areas of the brain associated with that activity. Another type of fMRI study examines the activity of different areas of the brain when a person is not doing any voluntary task, called rest-fMRI studies. Two general methods are commonly used to process fMRI images: model-based methods and data-based methods. In task-based fMRI, mainly GLM-based methods are used. However, data-based methods are used to determine functional connectivity in rest-fMRI.
In image processing laboratory, it is possible to analyze both types of practical studies mentioned. FSL and SPM software, which are the most well-known software in this field, are used to analyze task-based fMRI data. Rest-fMRI data analysis can also be performed using FSL and DPARSF or CONN.

Figure 2: An example of analyzed fMRI image. The active areas are marked in yellow and red.

Figure 3: An example of analyzed task-based fMRI.
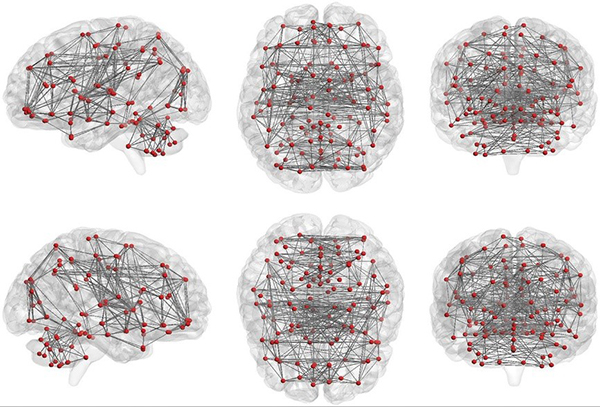
Figure 4: An example of analyzed functional connectivity by CONN.